
Finally, Live Formulas are new in Calxa this month. It’s been a big task for our team, but we now have live recalculation of budget formulas. Set one account as a percentage of another and it will automatically recalculate when the underlying account changes. Create a driver-based budget from a series of Metrics and the changes will cascade through your budget model as you watch.
Automatic Recalculation of Formulas are New in Calxa
You do not always want your formulas to recalculate so we have made it optional. When adding a formula, you can now choose to set it live at the top right: 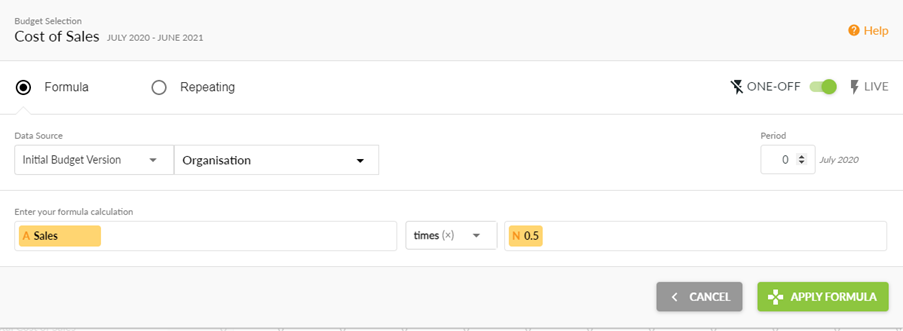 In this example, the cost of sales budget is calculated immediately as 50% of the sales line. Changing the Sales budget will automatically trigger a recalculation of the Cost of Sales budget.
Using Metrics and Multiple Levels of Recalculation
In our recent article on payroll budgets, we explained how to build your formulas from Metrics. Starting from the number of days each person worked each month, multiplying that by the daily rate to get a monthly total for each. The final step was to combine each employee’s wages to show the total for the department or organisation. Now when setting this to LIVE, any changes to the number of days worked or the daily rate will flow through automatically to the top level.
Other Budget Changes are New in Calxa
Also new in Calxa recently, are some budget betterments. We have been working on a series of improvements to budgets over the past few months and these are some of the highlights:
- Budget by quarter or year. Just change the layout and quickly edit amounts for a quarter or a year. Changes are applied proportionately to each month.
- Account Trees and editing total rows. In the Filter, set the Account Tree to use when grouping your accounts for budget purposes. When a header row is contracted, you can edit it and those changes will apply proportionately to the underlying detail rows.
- Improved selection of Business Units: You can now quickly search and filter your business units, green dots indicate those with data. You can show and hide the inactive ones as well as those with or without data.
New Budget Reports
We have added a series of reports to help you more easily compare your new year’s budget to the previous year actuals or budgets. There’s a couple that work on a date range to give you the high-level overview and then some detailed, month by month views. As usual, you will find them flagged with the NEW mark in the Report Builder. We have also recently added to the 3-way forecast report range, ensuring a consistent set of date options across the P&L, balance sheet and cashflow forecasts, from 1 to 10 years. What is also new in Calxa, is the added flexibility to the cashflow forecast chart. Namely, it now has the option of running monthly, quarterly or annually for any number of periods.
What’s next?
Next up for budgets will be the option to swap the 2 left hand columns. You will be able to select a single account and then budget for that account across multiple business units. This will be great when you want to reallocated sales, wages or overheads across departments. Plans for features new in Calxa include the final piece (for now) of Metrics imports and improved sorting within the Metrics screen. Meanwhile, the rest of the team are busy working on adding more flexibility to business unit budgets and reporting. Watch this space! So, for now, that’s what’s new in Calxa. Keep adding your thoughts to the feature wishlist! To find out more about Calxa’s new features, go to our Product Info articles or check out our change log.