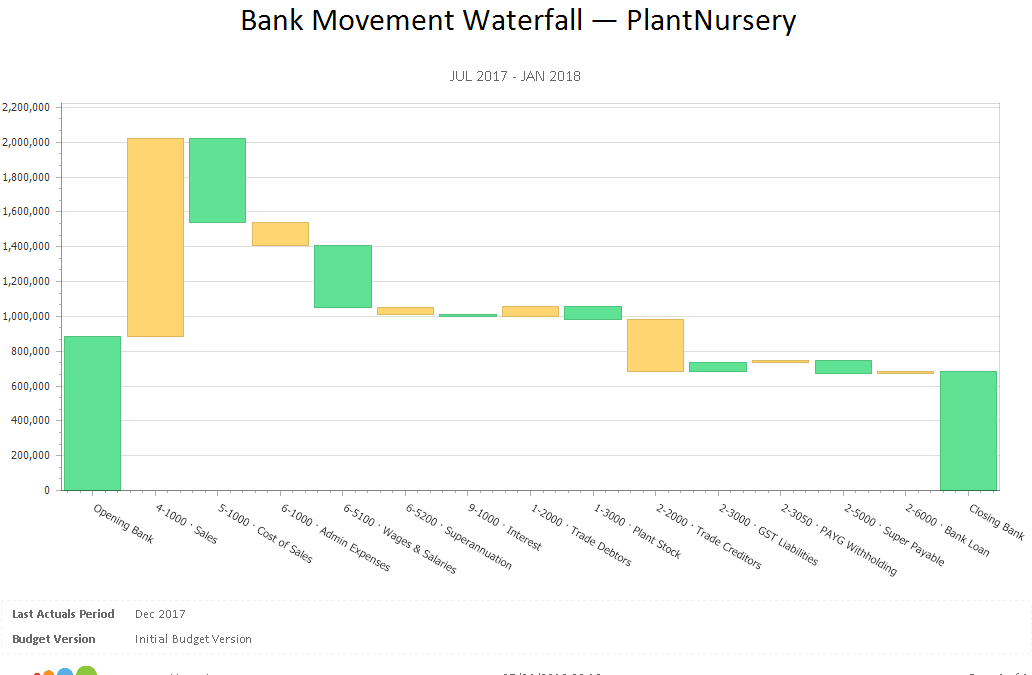
Bank Movement Waterfall Chart
This chart visually represents the cumulative effect of the positive and negative movements on your bank balance. Each bar starts at the position the previous bar finished thus showing the cumulative effect of the inflows and outflows.