by marketing@calxa.com |
These trends led Stephen Floyd to review the way the organisation managed and reported on their finances to provide more efficient and timely reporting to management. The previous budget involved a series of spread sheets, which were cumbersome and not easily changed. There were then challenges with transferring and matching data from the accounting system with the budgets. The result was a reporting and management system that was less than ideal: It was time-consuming to manage, time-consuming to update each month and difficult to respond to rapidly changing needs.
by marketing@calxa.com |
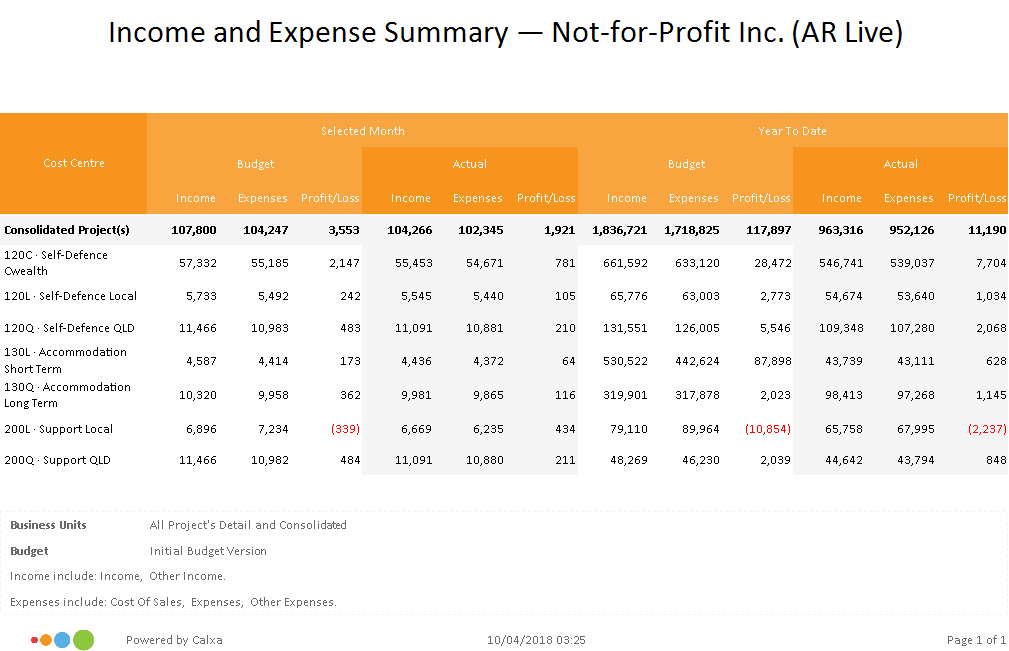
Show cost centre managers just the detail they need to get the job done. In this example that’s one cost centre and just the expenses that the manager controls. Quickly see what has been allocated and what’s left to spend.
by marketing@calxa.com |
In this mode, you have just as much creative freedom as you do when making any other page with the Divi Builder. See The Builder Overview.
by marketing@calxa.com |
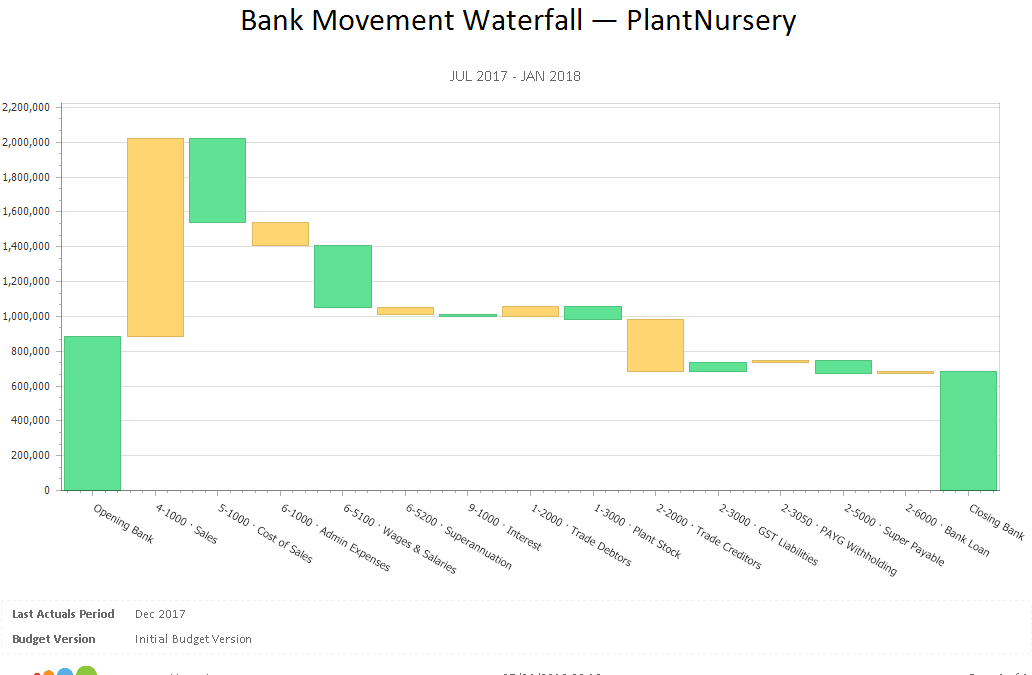
This chart visually represents the cumulative effect of the positive and negative movements on your bank balance. Each bar starts at the position the previous bar finished thus showing the cumulative effect of the inflows and outflows.